
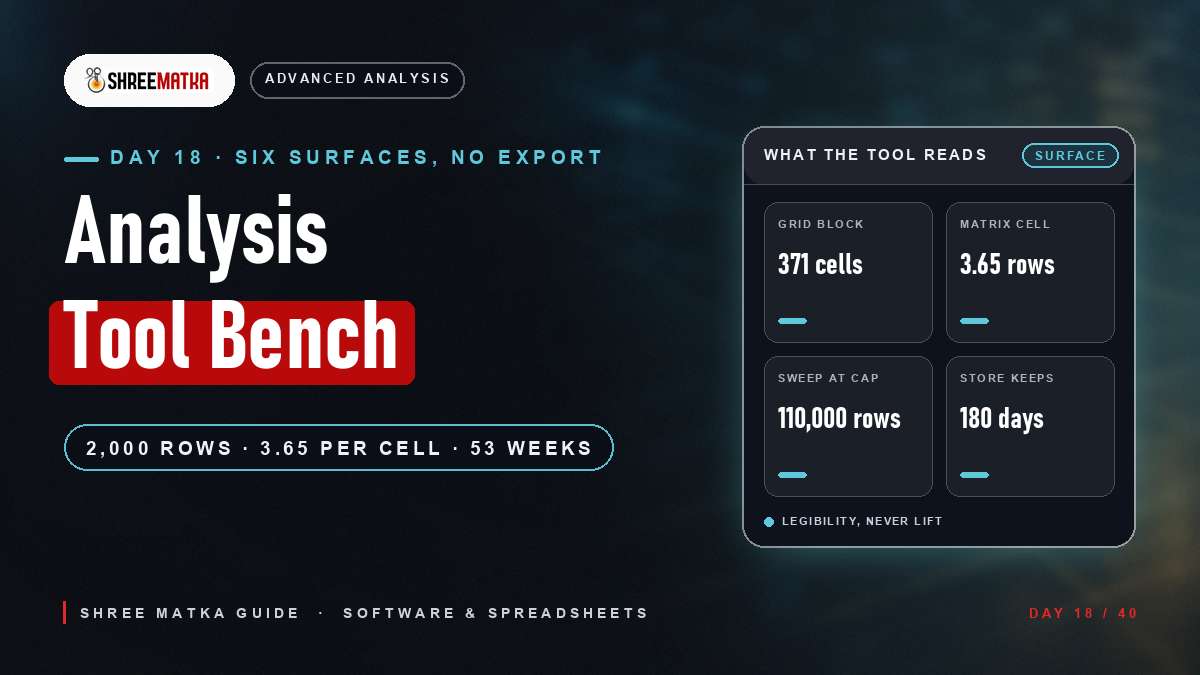
What Each Analysis Tool Actually Reads
Every Matka tool on the market — template, statistics workbook, notebook, purchased dashboard — reads one of six surfaces, and that is the whole of its power. Two answer in JSON, three render HTML built for eyes, one is an index written for machines. Sorting the classes by what they can be shown to have read beats sorting them by price, because every defect below is inherited from a surface rather than from the software.
The declaration feed is the workhorse, and its contract disagrees with its own documentation. The endpoint advertises a page size between 1 and 100; the service overwrites it, hard-coding a fetch of the first 2,000 rows because older client apps mishandled paging. Pagination metadata is still returned, so a tool that counts total pages and loops re-downloads one window and reports a complete pull.
GET /market/list — no declarationsGET /market/{id}/chart — newest firstGET /market/{id}/results — published rowsGET /chart/jodi, /pana, /starline, /jackpotGET /config/app?clientId= — configurationGET /sitemap.xml, /llms.txt, /robots.txt
Access surprises twice more. Only the /api prefixes ask for a session, so the chart feed — served under /market — answers anonymously, while robots.txt, which forbids /api/, never mentions it. Betting data stays behind the session. A tool author inherits no politeness rule for the JSON and writes one.
| Tool class | What it reads | What it produces | What it cannot see |
|---|---|---|---|
| Spreadsheet template | a paste of the grid or the JSON | counts, hot lists, coloured cells | the days that were never declared |
| Statistics package | a CSV someone typed by hand | tests, coefficients, p-values | whether its own validity rule is met |
| Notebook or CLI | the declaration feed, fetched on purpose | a dated, re-runnable snapshot | the rate card unless it asks |
| Vendor Matka software | whatever its seller stored | predictions, usually as pictures | this schema at all |
| Chart add-on | the same six digits again | a better-looking grid | the empty state it was handed |
Spreadsheet Templates: The Import That Breaks First
The spreadsheet is the most-used Matka analysis tool and the least trustworthy, because it starts with a copy-paste of a page designed for readers rather than parsers. The weekly grid runs eight columns — one date column plus seven days — and that date column is a single cell holding four stacked lines: year, start, end, blank. The pana chart reuses the same eight columns and stacks three values inside every day cell.
The placeholders are the expensive part. A day with nothing declared renders as three asterisk strings, which paste as three non-empty values, and the grid is Monday-anchored and rolling, so 365 declarations occupy 53 weeks and 371 cells. Six of them are padding, 1.6 percent of the block, counted as data by any sheet that counts rows.
| Element on the page | What it looks like | What the importer gets | The fix |
|---|---|---|---|
| Week range cell | four stacked lines, one box | one field, or four wrong columns | split on the line breaks; keep the year |
| Pana day cell | three stacked values | one cell, or a broken triple | parse as text, then slice |
| Undeclared day | asterisk placeholders | three non-null strings | map to null before counting |
| A jodi like 03 | two characters | the number 3 | store every code as text |
| Week with no results | a row of placeholders | a row of data | count declared days, not rows |
| The grid itself | a 365-day rolling window | “complete history” | date the snapshot, then archive it |
JSON carries the same hazards with a twist: the server decides. A date qualifies for the feed if either session has a first digit, and the three-digit patti string is emitted only when all three are present, so a half-declared day arrives as a real row with a null panna, a null ank and a populated close pair. Storage keys one record per market and date holding both sessions, so a session-keyed sheet collides on every append.
Two integrity rules close the lane, and both live elsewhere on this site: leading zeros are data, and headings must travel with the numbers. A template that loses either has not imported a chart; it has invented one. The expectation column’s arithmetic is in the analysis guide.
Statistical Software Options: Valid Tests, Invalid Samples
Every statistics package will run the test you ask for, and none will ask whether the sample can carry it. The record is thin in a checkable way: one market row over one year places an expected 3.65 declarations in each cell of a 10 × 10 transition matrix, which is the analysis every panel-chart tool advertises.
365 × 0.10 = 36.536.5 ÷ 10 arrivals = 3.65100 of 100(10 − 1) × (10 − 1) = 8181.0 and 12.73103.63The textbook condition is that no expected count fall below one and no more than a fifth below five. All one hundred cells fail the softer test, so the printed statistic is attached to a model the data cannot hold. Pool the 25 MAIN rows, expected counts rise to 91.3 per cell, the test becomes legal — and the question changes from what this market does to what the board does.
Correlations fail quietly. Asked for the link between yesterday’s ank and today’s, a sheet returns a coefficient and no band, and the band is the finding: 36 usable pairs put a true zero inside plus or minus 0.341, 365 pairs narrow it to 0.103, and 2,000 are needed to get inside 0.044. A coefficient of 0.2 in a market-row-year is the noise floor wearing a badge.
| Test a package is asked for | What it assumes | What the record supplies | Verdict |
|---|---|---|---|
| Chi-square, 10 × 10 matrix | expected counts above five | 3.65 per cell, one row-year | computed, not earned |
| Pearson on lagged anks | paired metric measurements | 36 usable pairs per column | quote the band, not r |
| Regression on the number | an ordered response | ten unordered labels | invalid; count instead |
| ANOVA across markets | independent groups | 25 rows on one shared feed | pooling rewrites the claim |
| Monte Carlo of a strategy | a stated rule and stake | rates are configuration | honest only if the card is read live |
The multiple-comparison tax is simple arithmetic. Test five independent formula columns at the five-percent level and 22.6 percent of runs produce a “significant” cell by construction; ten reach 40.1, twenty 64.2, forty 87.1. A dashboard with forty indicator columns manufactures findings that were never in the data, and the remedy is paperwork rather than software: one hypothesis, named first, on a window nobody retunes — the Kalyan protocol is this series’ template.
Custom Tool Development: The Minimum Useful Build
Custom code is the only class that can be made honest end to end, and the honest part is cheap: a fetcher, a schema, a log. The six-stage build is the prediction-system guide; this lane covers only what the tool layer gets wrong when a builder copies a template and inherits its bugs on top of their own.
- Fetch codes as text: date, market id, both panas, both anks and the jodi, every one of them a string, so a leading zero survives the round trip.
- Write provenance: endpoint, extraction timestamp, row count received and the window the page was showing when the copy was taken.
- Expect nulls: the row set is “at least one session published”, not “complete”, and a partial panna arrives as nulls.
- Key on market and date: storage holds one record per market per day carrying both sessions.
- Ignore the paging fields: total pages is computed against a page size the service overrode.
Provenance is not decoration. A declaration can reach the feed before it reaches the day sheet, because the feed is open while the sheet is gated on a published flag, and upstream rows arrive through a poller on a sixty-second fixed delay behind a switch that defaults to off. The newest honest timestamp in the archive is an arrival, not a draw; the publication-date guide and the differing-results guide both turn on that line.
What the build should refuse is worth more space than what it should include. No column in the schema stores a hot, due or trend number, so a tool that displays one displays its author’s assumption; there is no export to wrap, so a tool advertising one-click CSV is a client-side copy of a manual pull; and the result path holds no draw mechanism to model. Reproducibility is the deliverable: one command, one dated file, a diff someone else can re-run.
Data Visualisation Techniques: Charts the Record Can Carry
A chart is a claim about ordering, and this record supports some and refuses others. A jodi is two nominal digits, so a line chart of jodis puts labels on a numeric axis and invents an ordering in which 58 sits between 48 and 68. The charts worth drawing come with a band attached.
36536.55.7346.1mean 18.6, 95th percentile 27mean 3.29, and 8 in the tailThose figures are chance, measured over 4,000 simulated uniform years: the tallest ank bar averages 46.1 against 36.5 expected, and the gap between tallest and shortest averages 18.6. Anyone who reads that picture as a hot ank is reading sampling variation in colour. The fix costs one line of drawing — plot the expectation at 36.5 and the 25-to-48 band behind the bars.
| Visualisation | What it can honestly show | The trap it sets | Draw it when |
|---|---|---|---|
| Bar chart of ank counts | frequency against expectation | noise reads as a trend | the band shares the axes |
| Print of the weekly grid | the layout a human verifies | placeholders become data | headings travel with it |
| Heat matrix, 10 × 10 | a board-wide count | pale cells read as a pattern | pooled across market rows |
| Hourly slot chart | ten sessions in one day | a day plotted as one point | the 90-day window is stated |
| Cumulative stake and return | your own behaviour over time | implies the picks were informed | always, and first |
Two charts deserve the bin. A line of jodis is invalid for the reason above, and a heat matrix drawn from one market row is the chi-square in paint: a few observations per cell dressed as a pattern. Pooled across the 25 MAIN rows the same matrix is a different, legal object — the distinction the chart-patterns guide draws for readers.
Starline breaks the daily assumption twice: fifteen columns — date, day, ten hourly slots — and a 90-day window rather than 365, with empty slots shown as placeholders. A visualisation built for one declaration per day plots a market that declares up to ten. The hourly-market guide covers the geometry, the pana printing guide the one chart players actually use.
Automation Possibilities: Crons, Caches and Ceilings
Automation in this niche means, in practice, a scheduled fetch and a diff. The machinery is open, the boundaries are measurable, and the binding constraint is not the one people quote.
25 MAIN rows × 2, plus starline, plus 4 jackpots5555 × 2,000 = 110,00025 × 2 × 365 = 18,2506.03150 per ten seconds, 500 per minuteA daily sweep fits inside one burst window, so the limiter is not the constraint; the ceiling is. Because every request hands back the same capped, newest-first window, a sweep at the cap asks for 110,000 rows against the 18,250 declarations a platform-year holds — a sixfold over-fetch before a useful byte arrives. An hourly collector diffs on market and date rather than counting rows.
The platform automates itself, and a scheduled tool should know it. The upstream poller writes on a sixty-second fixed delay; a cache-warming job runs every twenty seconds between 12:00 and 21:59 IST against a thirty-second TTL, so a fetcher polling faster than half a minute reads a cache; the cleanup job runs daily at 03:30 IST, refuses 10:00 to midnight and aborts past thirty minutes.
That last job is the fact most tool owners have never heard. Twenty tables carry retention rules and market_days — the declaration store itself — is among them: 180 days, deleted in batches of a thousand, only for rows marked fully declared. Bets go at 90 days, starline bets at 45, and the money tables are never touched, so a dated snapshot on your own disk is the only corpus that exists.
Two facts end the cleverer automation ideas. There is no RSS, Atom or webhook anywhere in the routing, and the sitemap stamps every chart URL with today’s date whatever changed, so a cron watching lastmod learns nothing. The same index does list all 55 chart URLs, and the llms.txt file directories the same surfaces: discoverability is excellent, change notification does not exist.
Choosing a Tool: What Each Class Buys and What It Costs
The classes line up by what they can be shown to have read. The column that decides a purchase is not features but repeatability: whether anyone else can re-run the result.
| Class | Setup effort | Maintenance | Genuinely good for | Silently wrong about |
|---|---|---|---|---|
| Spreadsheet template | an afternoon | re-breaks at every import | reading one week at a time | placeholders and padding |
| Statistics package | a day, if the CSV is clean | the CSV is never clean | testing a hypothesis written first | its own validity conditions |
| Custom fetcher and sheet | a weekend | a script, not a habit | dated, re-runnable snapshots | nothing, if provenance is kept |
| Vendor Matka software | a payment | someone else’s opacity | pictures for a forum post | the schema it never reads |
| Printed grid and pencil | none | none | verifying what you can see | arithmetic at scale |
The honest recommendation is a stack rather than a product: a fetcher that keeps every pull dated, a sheet that mirrors the grid’s shape instead of prettifying it, one pre-registered test per question, and a ledger of your own picks priced from the live rate card rather than from a remembered one. It reports a flat year as a flat year. The verification guide covers checking a source’s records before importing them.
It is worth naming what “serious player” means in tooling, since the phrase sells software. It does not mean better statistics; at 3.65 observations per cell it cannot. It means the boring three: a dated dataset nobody edits, one hypothesis written before the window opens, an exposure limit that ignores the last result. No tool on these surfaces moves a 1-in-10 digit or a 1-in-100 jodi.
Tool Limitations: What No Purchase Fixes
- Nothing exports: no CSV writer, no file endpoint, no archive download in the platform; every dataset is a copy pulled by hand.
- Every window rolls: 365 days on the jodi and pana grids, 90 on starline, 2,000 rows on the feed whatever was asked.
- The store is not a library: a nightly rule deletes fully declared market days past 180 days, in batches, and keeps its own log 15 days.
- Samples are thin where it matters: 3.65 declarations per matrix cell in a market-row-year; 36 usable lag pairs per column.
- Packages do not police themselves: they compute tests whose conditions the data fails and print the result without the caveat.
- Noise is colourful: a uniform year still draws a tallest bar of 46 and a run of four, which is what a hot-list feature is.
What survives all of this is still worth building: dated snapshots, a schema that keeps codes as text and gaps as nulls, one hypothesis per window, a chart with its expectation line drawn, a ledger priced from configuration. That is what a tool actually buys — the ability to be wrong in front of yourself, on the record. Intended for readers aged 18 and over.
Frequently Asked Questions
What software is used for Satta Matka data analysis?
Can I build my own Matka analysis spreadsheet?
Which spreadsheet template should I use for Jodi and Pana charts?
Do statistical tools improve Matka prediction accuracy?
Is there an API or export for Matka results?
What Matka charts or visualisations are actually worth drawing?
Can I automate Matka result collection?
What are the limitations of Matka analysis tools?
Download the Official Shree Matka App
Experience real-time live results, complete historic panel records, and 24x7 verified automated withdrawals on your Android smartphone.
Download App
Comments (0)
Loading comments...