
What A Kalyan Strategy Can Actually Do
A strategy and a prediction are not the same object, and most disappointment attached to Matka “technical analysis” comes from confusing them. A prediction is a claim about tomorrow’s declared digits; a strategy is a written decision process — which market you study, what must be true before you act, how much you commit, when you stop, and how you judge afterwards whether the process was sound. No chart can deliver the first. The second can be built and audited, and on a market as densely recorded as Kalyan it is the only serious game in town.
This article works through the six things advanced Kalyan readers actually try to do — apply cut number rules, run panel sum calculations, analyse the open-to-close relationship, recognise historical patterns, combine indicators and manage risk — and states what each one legitimately buys. The vocabulary is not redefined here: the glossary carries the platform labels, the Kalyan chart reading guide the decoding arithmetic, and the odds and payouts guide the rate maths.
The first decision a Kalyan strategy has to make is which Kalyan it means, because there are three separate markets in the schedule and they are not interchangeable:
| Market | Type | Open | Close | Bet families that exist |
|---|---|---|---|---|
| Kalyan | MAIN | 04:10 PM | 06:10 PM | Ank, jodi, panna, sangam |
| Kalyan Night | MAIN | 09:20 PM | 11:20 PM | Ank, jodi, panna, sangam |
| Kalyan Starline | STARLINE | 10:00 AM | 11:00 AM | Ank and panna only |
Three consequences follow. A jodi, cut-pair or sangam rule has no application to Kalyan Starline, because its bet model carries only ank and the three panna families — so any “Kalyan jodi trick” silently assumes one of the two MAIN markets. A pattern in “the Kalyan chart” is not one series if it mixes afternoon and night; those are separate records, and one archive blends two processes. And the session windows are fixed data on the market row, so timing in any open-to-close idea is decided by the clock before the maths.
Cut Number Rules Application
The word “cut” in tipster traffic means one arithmetic relation: the cut of an ank is the digit five away from it. On a ten-step circle that pairs the digits off permanently — cutting twice returns the original, and no digit has two cuts:
cut(x) = (x + 5) mod 10
0–5 • 1–6 • 2–7 • 3–8 • 4–9, and each reversed
red highlight when digits are equal or differ by exactly 5
10 pairs
10 pairs
20 of 100 = one day in five
What the platform does not have is a cut number as data. A stored result is six digits and two timestamps — three open, three close — and everything else on the page is computed from them. There is no cut column, no cut validator, and no bet type that settles on a cut.
And the label does not survive a probability check, which is the test any strategy idea has to pass. Once the open ank is declared, the day’s cut pair is completed by exactly one of the ten possible close anks — one in ten, the same as any other named close digit or a digit chosen blind. A rule whose hit rate cannot beat a random pick is vocabulary, and vocabulary is worth using only for organisation.
- Legitimate use — grouping and filtering. Ten cut pairs are a coarser bucket than one hundred jodis, so a ledger keyed on pairs is easier to scan across a year, and the red marks are a fast way to find rows worth auditing for transcription errors.
- Illegitimate use — selection. Treating a cut as a reason to expect a number turns a label into a forecast, and the arithmetic above is where that turn fails.
Panel Sum Mechanics: What The Reduction Hides
The reduction itself — add the three digits, keep the unit digit, and the open and close results give the jodi — is taught in the chart reading guide and not repeated. What matters at the strategy layer is the property beginners never notice: the reduction is massively many-to-one, and the collapse is exactly even.
| Quantity | Value | Why a strategist cares |
|---|---|---|
| Possible declared panas per session | 1,000 | each of three digits is 0–9 with no further restriction |
| Panas reducing to any single ank | exactly 100 | no ank is structurally favoured; 10% is not an estimate here |
| Distinct unreduced digit sums | 28 (0 to 27) | several different totals share one ank — 12 and 22 both give 2 |
| All-digits-different panas | 720 of 1,000 | the single-panna family is 72% of declarations |
| Exactly-two-same panas | 270 of 1,000 | the double-panna family is 27%, roughly one day in four |
| All-three-same panas | 10 of 1,000 | the triple-panna family is 1%: about once per hundred sessions |
Those family counts are not folklore — they are the platform’s own validation rules, which reject a panna bet unless its digits fit the family it is placed under. Enumerating the one thousand admissible declarations against those definitions splits them 720 / 270 / 10, and that is the correct base rate for a “family tracking” strategy on this grid. A week with two triple panas is not a signal; it is a small sample of a one-in-a-hundred event, and the difference between those sentences is the whole content of an honest strategy note.
Two structural facts matter. First, the unreduced total is invisible on the chart: the grid prints the pana and the reduced ank, so sums of 12 and 22 occupy the same cell, and anyone describing “the panel sum rising” across a week is reading a quantity the record does not display. Second, a jodi is not a stored object either — the getter that builds one from a single result is deprecated in the code, because a jodi is the open ank of one session followed by the close ank of another. There is no jodi trend inside one declaration, only across days.
One caution about books. The traditional 220-entry pana book is a catalogue convention, not a constraint on what can be declared — the platform accepts any three digits. The 220 patti chart list is still the right tool for a chart written in that shorthand, but a strategy has to say what it does when a declaration falls outside the book it was built on.
Open-To-Close Probability Analysis
The chart exposes this structure honestly, including its incomplete state: when only the open has been declared, the day’s jodi renders as the open ank followed by a placeholder — a visibly half-formed pair, which is exactly what it is.
Before the open, the day’s jodi space is one hundred pairs; after it, the first digit is fixed and the space is ten. Nothing in the open session constrains which of those ten arrives, because the two sessions are separate records with separate digit columns and separate declaration timestamps. Conditional on the open, the close is uniform over ten digits — the correct and complete statement of “open-to-close analysis.”
457 → 4 + 5 + 7 = 16 → ank 6
1 in 10
1 in 10
1 in 10
was 1 in 100 before the open, now 1 in 10
it removes nine tenths of the jodi space, not nine tenths of the risk
That box separates three things usually sold as one. Watching the open explains what the day’s record will look like; it does not guess the close; and it is no substitute for knowing when the window shuts. The market row carries open and close times, and the glossary’s session-lock entry says which bets stop at each boundary. A strategy that has not written down where it sits relative to those times has not specified when it acts.
Historical Pattern Recognition: Test The Claim, Do Not Just See It
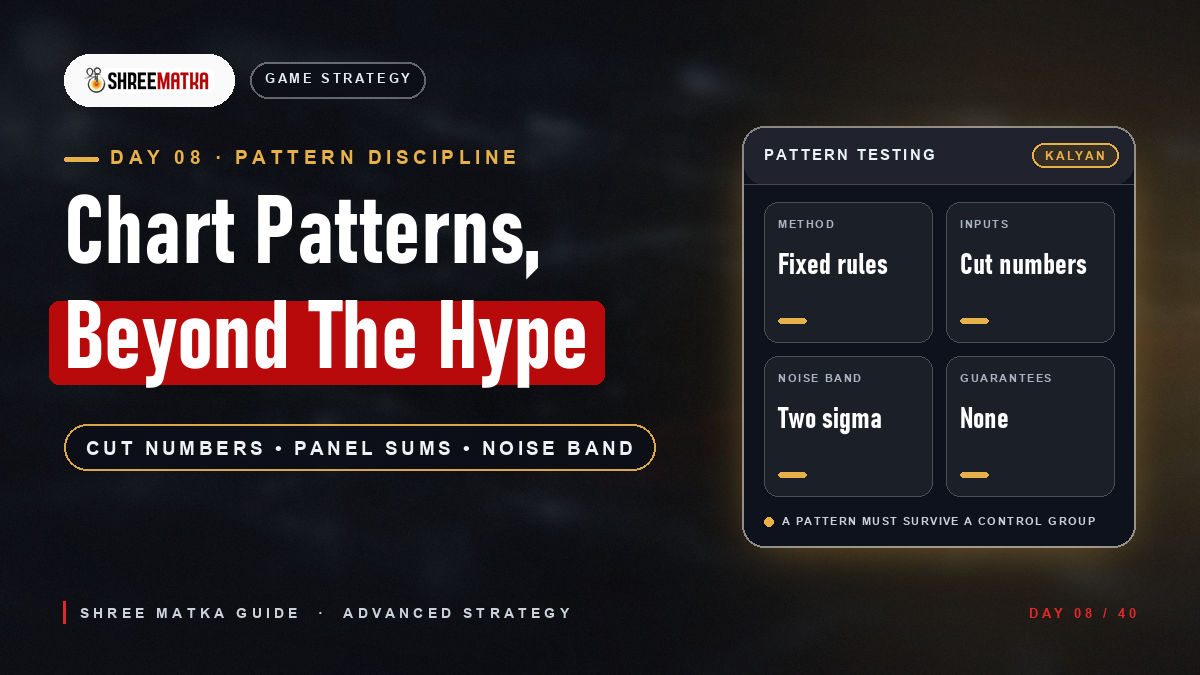
Everything called a “pattern” on a Kalyan grid is a count over a window, so the first job is knowing what that window is. The public Jodi and Panel chart pages build a rolling 365-day archive, group it Monday-to-Sunday, and print the newest week first; days with no stored declaration appear as placeholder asterisks rather than vanishing. An empty-looking row is therefore a gap in the record, not a week without draws, and the right denominator for a frequency claim is declarations, not calendar days.
Once the denominator is fixed, a pattern claim can be compared against what pure noise produces. For a one-in-ten event such as a specific ank, the table below gives the expected hit count and the band that ordinary variance fills for a player who never sees anything unusual:
| Window | Expected hits for one ank | Normal range (two standard deviations) | Standard deviation |
|---|---|---|---|
| 30 declarations | 3.0 | 0 to 6 | 1.64 |
| 90 declarations | 9.0 | 3 to 15 | 2.85 |
| 365 declarations | 36.5 | 25 to 48 | 5.73 |
Those bands are why “hot number” reading persists. Simulating two hundred thousand random 30-declaration windows, the most frequent ank appears six times or more in 60.5% of them and seven or more in 24.7%. Double the expected rate is the normal appearance of a month with nothing in it. A rolling year holds about twelve non-overlapping 30-day windows, so anyone scrolling the archive for a standout will find a dozen, all meaningless, all true.
The fix is not to stop looking at history; it is to make the claim falsifiable before it is made:
- Name the window before opening the chart. Thirty declarations from a stated date, not “recently”, and not chosen after seeing where the interesting numbers are.
- Count declarations, not dates. Placeholder rows are not misses.
- Write the threshold down. “Unusually frequent” needs the band from the table above; anything inside it describes noise.
- Test on data you did not use to form the claim. Found in the first half of a year and checked against the second, a pattern is an experiment; found and confirmed in one window, it is a memory.
- State what would change your mind. If nothing could refute it, the rule is not a strategy component and does not belong in the ledger.
Combining Multiple Indicators: The Triple-Counting Trap
A Kalyan day produces a stack of derived quantities, and the temptation is to treat each as a separate witness. They are not; they are the same event written in different units, and a strategy that “confirms” itself four times over one declaration has counted one observation four times:
457
4 + 5 + 7 = 16 → ank 6
230 → 2 + 3 + 0 = 5 → ank 5
65, built from the two anks above
no: 6 and 5 differ by 1, so neither the double rule nor the cut rule fires
single panna: all three digits different
Genuinely independent observations do exist, and they are exactly three kinds: the other session of the same day (a separate result record with its own declaration timestamp), the other market day (the schedule stores at most one row per market per date), and the other market — Kalyan, Kalyan Night and Kalyan Starline are separate records again. Stacking indicators drawn from the same six digits adds paperwork, not evidence.
So the honest way to judge a multi-indicator system is two questions. How many independent observations does it wait for before acting? If the answer is one, the other columns are decoration. And how many decisions does it change? An indicator that never flips an action is the first one described differently. Systems that survive both questions tend to be short, which is another sign they are real.
Risk Management In Strategy: The Part You Actually Control
Risk management is the only section here whose instructions can be followed perfectly, because every item is a decision the reader makes alone and in advance; none depends on what the draw does. It is also the only part of a Kalyan process with a defensible claim attached: it cannot improve expected return, but it decides how long a process survives and whether its record is readable afterwards.
Kalyan open 04:10 PM / close 06:10 PM — not “Kalyan” generally
one named bet type, from the glossary labels
a countable condition over a stated window, written as a test
a fixed fraction of the bankroll, never a fraction of the last result
the maximum number of bets placed on one session
a loss cap and a date cap, both numeric
100 logged declarations minimum before any rule change
the specific record that would retire this rule
The review point and the kill criterion are what separate this from the pre-session sheet in the beginner mistakes guide, which stops one session from doing damage. Here the object is the rule itself. Log each declaration against the entry condition — market, session, rule fired or not, unit, outcome — and keep a note column for improvised lines, because that is where the strategy actually lives. Only after a hundred entries does the ledger show whether a rule survived its own base rate: a one-in-ten rule misses nine times out of ten.
On the money side, the sizing argument belongs to the bet-type comparison rather than being re-run here: a bankroll has to survive roughly three times the expected gap for whatever is being staked, and gaps of that length are ordinary rather than unlucky. What this section adds is the Kalyan version of the same point — a day is two MAIN declarations, so a per-day cap and a per-declaration cap are different numbers, and if only one is written down, the other quietly does not exist.
The Honest Limit Of Prediction Techniques
It is worth stating plainly what none of the above delivers, because “prediction techniques” in this title is the phrase things are sold under. No cut rule, panel sum, open-to-close reading, pattern count or indicator stack moves a one-in-ten to a one-in-nine, or a one-in-hundred jodi. Each session arrives as three independently entered digits, and every column the chart shows is computed from them afterwards — analysis works on a record produced after the outcome was fixed.
What is genuinely predictable about Kalyan is the shape of the archive, and knowing it cold is what “advanced” actually means here:
- The ank. Exactly 100 of the 1,000 admissible panas reduce to each digit, so a frequency claim over a short window measures variance, not bias.
- The families. A 72 / 27 / 1 split across single, double and triple panas, fixed by the platform’s own bet validation.
- The highlights. Red marks cover 20 of 100 pairs — doubles plus the ten cuts — one day in five.
- The window. A rolling 365 days on the public charts, weekly rows, newest first, gaps printed as asterisks.
- The cost. The hold in the odds and payouts guide is unchanged by method, and no strategy document alters it.
The commercial form of the other claim is worth naming once. Paid “sure” numbers, advance-fee tipster lines, and screenshot archives of hits with no record of the misses all depend on readers not applying the falsifiability test from section 5. The platform-verification framework covers the same ground against the seller rather than the number, and why results differ between websites covers why an unofficial chart’s history proves nothing. This site publishes records and explains them; it sells no numbers.
Frequently Asked Questions
What is a cut number in Kalyan Matka?
Can Kalyan chart patterns predict the next result?
How much Kalyan history is available to study on this site?
Why does every ank digit appear about 10% of the time?
Does strategy differ between Kalyan, Kalyan Night and Kalyan Starline?
Does combining several indicators improve accuracy?
What belongs in a written Kalyan strategy?
Does following a documented strategy change expected return?
Download the Official Shree Matka App
Experience real-time live results, complete historic panel records, and 24x7 verified automated withdrawals on your Android smartphone.
Download App
Comments (0)
Loading comments...