
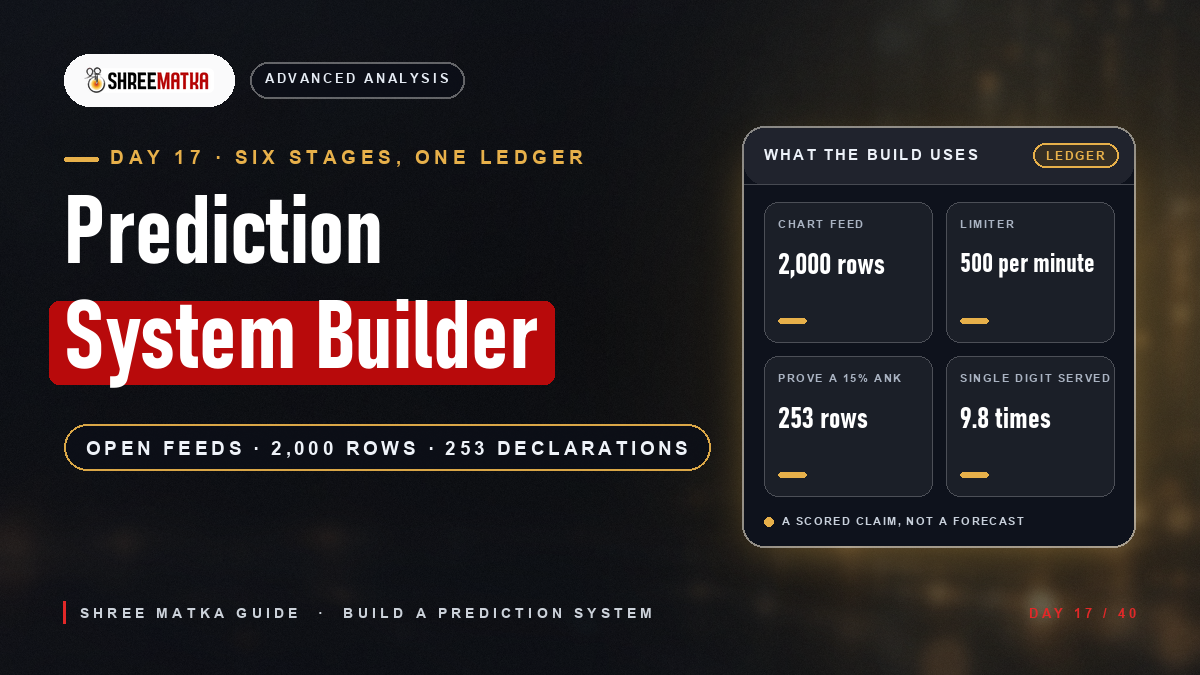
What a Prediction System Is Actually Made Of
The phrase carries two promises with nothing in common. In the tipster sense it says what the next number will be; in the engineering sense it is a pipeline that says what a claim performed. Only the second is buildable from what this platform publishes, and it is the only route to the first: a system that cannot be scored is not a weak prediction system, it is not one at all.
@state visible before the declaration lands@one value not declared yet@a mapping to a stated distribution@pre-registered metric on held-out rows@timestamped predictions, append-onlyThe definition is unromantic and it survives the record. The visible state is six digits per session plus a date, a market row and timestamps; the value is one more row of six digits. The chart-patterns guide established why that matters: the platform stores results rather than generating them, so there is no machine to model and no mechanism a feature could describe. What remains buildable is the measurement.
| Stage | Question it answers | Deliverable | What it can hide |
|---|---|---|---|
| 1. Data collection | what history exists and how it arrived | a dated, typed dataset | rows never declared |
| 2. Variables | what is knowable before the event | a timestamped feature list | the target, renamed |
| 3. Algorithm | what mapping is claimed | a rule with its own distribution | assumed dependence |
| 4. Backtesting | did it perform | a walk-forward score and band | tuning on the answer |
| 5. Refinement | what changed, and why | one versioned change per freeze | quiet endless edits |
| 6. Tracking | what happened after the build stopped | the ledger, cap and kill rule | that nothing enforces them |
The null hypothesis is a mild number: a named ank lands 1 time in 10 and a named jodi 1 in 100, so over 365 declarations the digit expects 36.5 hits with a standard deviation of 5.73, making 25 to 48 ordinary. That band, derived in the statistics guide, is what every stage below is measured against. Beating it is news; missing it is the expected outcome, and a build that cannot report the second was never a test.
Stage 1: Data Collection Methodology
Collection is the stage a DIY build can get right: the platform publishes what it holds, and the market list, the chart feed and the HTML chart pages all answer without a session.
| Surface | What it returns | Session | Limiter | The catch |
|---|---|---|---|---|
/market/list | market rows, sessions, statuses | no | skipped | no results |
/market/{id}/chart | declaration rows, newest first | no | counted | page and size ignored |
/market/{id}/results | today’s declared sessions | no | counted | published rows only |
/chart/jodi/{market} | the weekly grid readers see | no | counted | 365-day rolling window |
/config/app?clientId= | the rate card in force | no | counted | empty in some modes |
The chart feed is the workhorse and its row shape is the dataset: date, open panna, open ank, close panna, close ank, jodi. Two of the six are computed rather than stored — the ank is the panna’s digit sum modulo ten, taken when the response is built, and the jodi is the two anks side by side. A builder who stores the feed as it arrives has stored the answer inside the features.
Two behaviours were learned live against a development deployment. Paging is overridden: the service asks for the first 2,000 rows whatever was requested, so a size of five reported a page size of 2,000 and a third page returned the same payload — while a size above 2,000 draws a clear 400, so the ceiling is real even if the dial is not. The date filters exist in the signature and do not work on that build: a valid from-and-to pair returned a server error where the unfiltered call succeeded.
@2,000, forced by the service@365@2,000 ÷ 365 = 5.48@none; no CSV writer existsThe limiter is worth respecting because it is measurable: 500 requests a minute, a burst bucket of 150 per ten seconds, a 429 with a Retry-After header when either runs out, and a remaining count on every allowed call, keyed by address for unauthenticated callers. In a fourteen-request capture the burst counter walked from 149 down to 137 while the exempted market list never touched it.
Provenance belongs in the dataset. Declarations can arrive from an upstream provider through a poller on a sixty-second fixed delay, writing through the same service the manual panel uses, behind a switch that defaults to off. The day sheet is gated on a published flag while the chart feed is not, so a row can reach a collector before it reaches the page. Keep arrival time, endpoint and extraction date on every row, and keep a jodi as text: a leading zero is the difference between 03 and 3.
Stage 2: Variable Identification
This is the shortest and most decisive stage, because the schema is short. A stored session carries three open digits, three close digits, a date, a market row and timestamps, and every feature must be computable before the target exists. That sentence eliminates most of what Matka software sells.
| Candidate variable | Where it comes from | Known beforehand? | Verdict |
|---|---|---|---|
| Weekday and calendar date | the date field | yes | usable; no expectation |
| Session (open or close) | the market row | yes | usable |
| Ank at lag one, two, three | stored earlier rows | yes | the whole honest feature set |
| Today’s open panna, target the jodi | the same declaration | only after it lands | leakage: half the answer |
| The jodi column itself | the two anks joined | never before both | the target re-read |
| Hot, due or trend columns | nowhere in the schema | not applicable | invented by the reader |
| Panel exposure | the bet table | behind a session | not public: 401 |
Read the table as a count: four kinds of honest variable exist — date, session, market identity and lags. Everything else is the target wearing a different name, or is not stored. A jodi is the open ank and the close ank side by side, so a model handed the close panna while asked for the jodi has been given the arithmetic it was supposed to guess; the column-heading guide shows how the same digits read two ways become two claims.
What is missing is as informative. There is no field for market mood, no column of expected numbers and no public surface for betting flow — the history and wallet endpoints answer 401 and 403 without a session — so a feature called “bookie pressure” cannot be built from this archive by anyone. The stage ends as a written list, annotated with the moment each feature becomes knowable.
Stage 3: Algorithm Development: Four Classes, One Assumption
Four classes of algorithm get built for this problem, and all four assume the sequence contains dependence. Writing the assumption down is what makes it testable.
- Frequency counters take a digit’s past rate as news about its next appearance, while the ordinary spread of 25 to 48 hits manufactures a convincing hot list every year.
- Transition matrices take the next ank as dependent on the last; the matrix has 100 cells and a year fills them thinly, so a pattern in one cell is sampling noise.
- Trained models take the lag features as signal, though 365 rows across ten classes leave every held-out window too wide to make a single result meaningful.
- Filter stacks take intersections as stronger than their parts, while each added filter costs a factor of ten in opportunities and moves no probability at all.
@10 × 10 = 100@365 × 0.10 = 36.5@3.65@1.81@5.5 entriesThat sizing point is the honest reason these models fail here. Telling a 10 percent cell from a 15 percent one needs dozens of observations per cell and a market-row-year supplies 3.65, so either the builder pools the 25 MAIN rows and inherits a different question, or the matrix is a decorated coin flip. A model trained on that year sees 36 examples per class, and a 36-declaration window carries 5.0 points of standard deviation on a 10 percent base rate: a reported 22 percent is one deviation from nothing.
Under the uniform reading the best prediction is the flat one, costing the natural logarithm of 10, about 2.303 nats per declaration. Every model above either matches that number with a thousand times the machinery, or beats it, in which case dependence has been found and a demonstration is owed.
The filter stack is what Matka software ships: deterministic rules, easy to backtest and impossible to keep honest. A stack has no tunable parameters, so builders assume it cannot overfit, but the choice of filters is the parameter, and it is made while looking at the history the stack then claims to explain. One kind of stacking works and is not about digits: a stake cap, a per-market ceiling and a dated review are independent of the declaration, so they move the builder’s money and nothing on the chart.
Stage 4: Backtesting Approach: Power Before Optimism
Backtesting fails two ways, both avoidable by design: scoring a prediction made after seeing the answer, and testing until something passes. The first fix is mechanical: walk forward, use only rows before each declaration, emit the prediction, store it against a timestamp that cannot be edited back, and observe only then. The second fix is arithmetic, and its number goes in before a line of code is written.
| Claim under test | Declarations needed | Market-years of one row | Feed requests |
|---|---|---|---|
| Ank hits 15 percent, not 10 | 253 | 0.69 | one |
| Ank hits 12 percent, not 10 | 1,471 | 4.03 | one |
| Jodi hits 1.5 percent, not 1 | 2,830 | 7.75 | two |
| Single panna 0.15, not 0.1 percent | 28,603 | 78.4 | fifteen |
| Half sangam 0.015, not 0.01 percent | 286,329 | 784.5 | 144 |
This table says which claims a hobbyist can afford. A 15 percent digit rate is provable inside nine months of one row from a single request. A 12 percent rate needs four years of one row, though pooling the 25 MAIN rows — 9,125 declarations a platform-year — brings it to two months of the board. The families that pay most cannot be tested at all: the sangam claim needs decades of every market running. Pick the fattest multiplier and you have picked the unfalsifiable.
Screening twelve independent systems at the five-percent level leaves a 46 percent chance that at least one passes with nothing behind it; twenty-five make it 72 percent. Twenty-five rows, two sessions, ten digits and a dozen rules make a machine for manufacturing survivors. The remedy is paperwork: one system, one metric, one threshold and one window, named before the run, using the Kalyan protocol as the template.
Reproducibility has its own trap. Every public window rolls — 365 days on the jodi and pana grids, 90 on starline — so the same query in March and in October describes different corpora. Record the extraction date, the endpoint and the row count received; without them, “it worked last month” is a memory.
Stage 5: Refinement Process: One Change, One Freeze
Refinement is where a built system quietly turns into a random one with better presentation. The failure is sequence rather than effort: change the rule after seeing the score and the number describes the tuning, not the claim.
@score, window, threshold fixed@retuning on it destroys it@several are unattributable@the dead versions are the evidence@n declarations reached, or the claim retiresProductive refinements change the question. Move the target from the day’s ank to a labelled family whose baseline is 20 rather than 10 percent and the same data answers a cheaper test. Move the horizon from the next declaration to the next two and a one-row signal either survives or dies. Move the population from one row to the board and the sample multiplies while the pooling question turns explicit. Each change moves a denominator, so each must be registered.
The unproductive refinements are the ones every tool advertises: add a feature, swap the classifier, retune thresholds, extend the lookback. They raise the backtest score reliably because they are chosen after seeing it, and leave the future untouched. If a change cannot be stated as a new claim about the world, it is a search for a nicer number. Version the dataset, the code, the extraction date and the log, so someone else can re-run the result.
Stage 6: Implementation and Tracking
Implementation is the ledger, and the ledger is the deliverable; everything before it was plumbing. Five fields, written before the first prediction:
- Prediction log: timestamp, market row, session, the stated pick and the rule version that emitted it, appended before the declaration exists.
- Expectation line: the count chance predicts for the same window, with its band, computed from the denominator rather than recalled.
- Observed result and verdict: hits against band, settled by a dated sentence on what the system failed to do.
- Money line: stake, the multiplier served, return per rupee, running exposure.
- Kill rule: the count or the date at which the claim retires, fixed in advance.
The money line must be priced from configuration rather than folklore, and this is where DIY sheets fail silently. The settling rate is read from the client configuration rows, falling back to hard-coded constants if a key is missing — fallbacks that are the older seed values, 9.5, 95, 140, 280 and 700, while a migration named for updating game win rates set the served card to 9.8, 98, 160, 320 and 1,000. A sheet built on the constants prices triple panna at 700 against a served 1,000: a 30 percent error in every expected-value line it prints.
| Family | Multiplier served here | Chance it must beat | Return per rupee at chance |
|---|---|---|---|
| Single digit | 9.8 | 1 in 10 | 0.98 |
| Jodi | 98 | 1 in 100 | 0.98 |
| Panna and sangam families | 160 to 10,000 | see the odds guide | 0.16 down to 0.01 |
Both families with unambiguous denominators return 0.98 per rupee at chance, and the full board of seven is in the odds and payouts guide; the displayed card against the settling rate is in the rate-table guide. The coincidence is the lesson: the card is built from the uniform space, so a system needs hit-rate lift rather than insight. Ninety-eight times a genuine 15 percent rate is 1.47 per rupee, and anyone who calls that reachable owes the 253 declarations that would prove it.
Nothing in the record enforces a per-day, per-market or per-family exposure limit, a cooling-off period or a loss cap, so every ceiling in the ledger is self-imposed; the market-card guide and the verification guide document that absence. The site’s own disclaimer puts the limit plainly: displayed records and historical charts do not guarantee or predict future results.
What a Built System Still Cannot Do
- The target is an archive entry: declarations are stored, mirrored from an upstream feed and editable; no draw mechanism exists on the result path.
- History is capped and rolling: 2,000 rows per request and sliding windows of 365 or 90 days make a dataset a snapshot, not a corpus.
- Four kinds of honest variable exist: date, session, market identity and lags. Anything richer is the target re-labelled, or is not stored.
- Most claims are unaffordable to test: the digit family is provable this year; the sangam families need decades of the whole board.
- Screening manufactures winners: twelve systems at the five-percent level leave a 46 percent chance of a false survivor.
- No guardrails are enforced: no cap, cool-off or loss limit exists in the record.
What survives is worth the build: a dated dataset, a short list of variables that can honestly be known, a rule that states its own distribution, a pre-registered test with its sample size chosen first, one change per cycle, and a ledger that will show a flat result as a flat result. That is a prediction system in the only sense the materials allow, and it will conclude that the next digit is a 1-in-10 proposition. For readers aged 18 and over; if that arithmetic describes your hobby, it is an argument for not betting on it.
Frequently Asked Questions
Can I build my own Satta Matka prediction system?
What Matka data can I collect, and how?
Is it allowed to pull Matka results automatically?
Which algorithm works best for Matka predictions?
How much history do I need to backtest a system?
Why does my Matka backtest score far above chance?
How do I track whether my system actually works?
Does better software make a better prediction system?
Download the Official Shree Matka App
Experience real-time live results, complete historic panel records, and 24x7 verified automated withdrawals on your Android smartphone.
Download App
Comments (0)
Loading comments...