
Basic Probability: The Space a Declaration Lives In
Start from the entity, because everything on a result line is derived from it. The platform stores a declaration as three integers between 0 and 9 plus a timestamp and a settled flag, embedded in the market day as an open result and a close result. The panna is those three digits in declared order. The single digit is never declared separately: it is computed at read time as the digit sum modulo 10, so a declared 382 carries the digit 3 everywhere it appears. The jodi is assembled only at settlement, when the open declaration’s digit is joined to the close declaration’s digit.
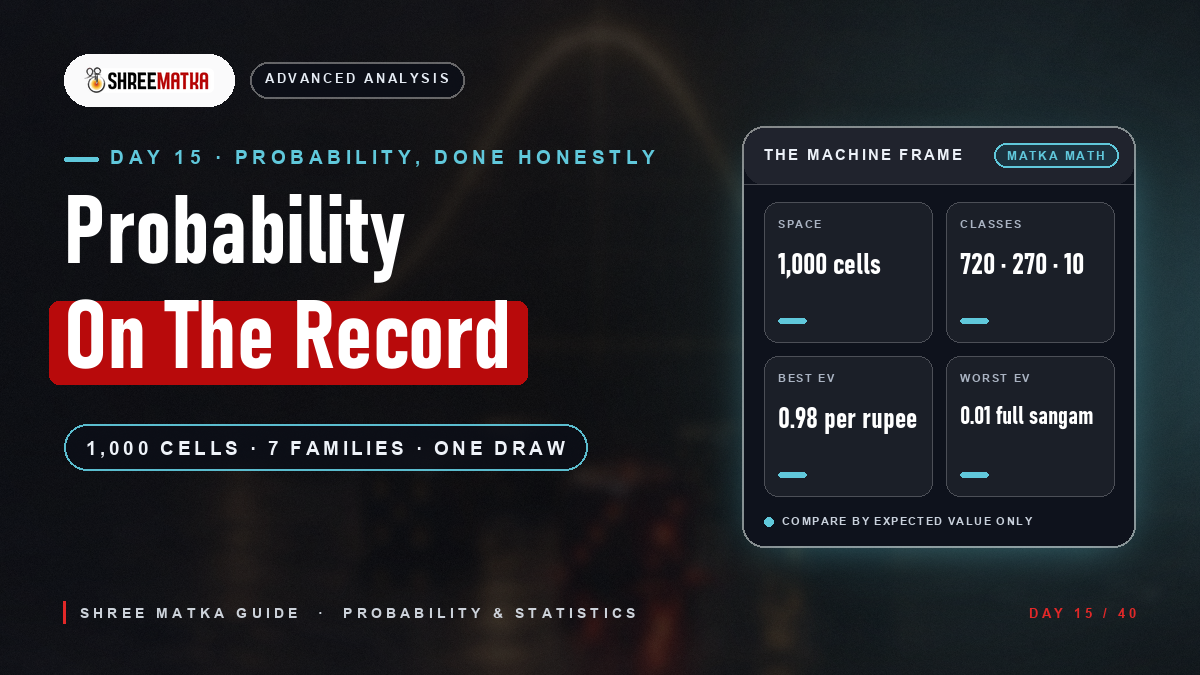
@1,000 cells@720 single, 270 double, 10 triple@exactly 100 each@exactly 100 eachThe exact counts are worth having because they are the denominators of every honest statistic. Each digit appears somewhere in exactly 271 of the 1,000 triples and appears exactly once in 243. The unreduced digit sum runs 0 to 27 and peaks at 75 triples for each of 13 and 14, with mean 13.5 and standard deviation 4.97 — a quantity no chart displays, which is why reading “rising panel sums” off a chart reads something the record does not even publish. The declared digit, the sum modulo 10, is perfectly flat: 100 triples per digit, no favourites.
Probabilities from a fixed space convert four ways, and keeping it handy prevents most arithmetic errors:
| Event | Probability | As 1-in-k | Break-even rate | Rate at 2% hold |
|---|---|---|---|---|
| Named digit (ank) | 0.10 | 10 | 10.0 | 9.8 |
| Named jodi (open + close digit) | 0.01 | 100 | 100 | 98 |
| Named panna (exact three digits) | 0.001 | 1,000 | 1,000 | 980 |
| Full sangam (both panas exact) | 0.000001 | 1,000,000 | 1,000,000 | 980,000 |
Break-even rate is simply 1 divided by the probability: the multiple at which expected value equals the stake. Every payout discussion on this site is a comparison of some configured rate against that column.
Two Spaces: The 220 Folk Frame and the 1,000-Cell Machine
Now the fork that changes every panna number you have ever read. The traditional frame sorts a panna’s digits ascending, collapsing the 1,000 raw triples into 220 canonical panas — 120 single, 90 double, 10 triple — and it is the frame the odds and payouts guide uses for its price comparisons. A pricing convention with long history; nothing here disputes its arithmetic.
The machine, however, does not sort. Bets are stored exactly as entered, gated only by class: single panna requires three distinct digits, double panna exactly two the same, triple panna all equal — which accepts all 720, 270 and 10 ordered triples respectively. Declarations are stored as declared, with no ordering step anywhere in the codebase. And settlement is positional: the bulk update marks a panna bet a winner only when all three stored digits equal the three declared digits in order, and the fallback matcher applies the same positional test.
| Panna class | Ordered triples accepted as bets | Canonical panas (folk frame) | Orderings per named set |
|---|---|---|---|
| Single (all distinct) | 720 | 120 | 6 |
| Double (exactly two same) | 270 | 90 | 3 |
| Triple (all same) | 10 | 10 | 1 |
| Total | 1,000 | 220 | — |
The consequence is exact. On the machine’s positional match, every named triple is a 1-in-1,000 event whatever its class — the class gates at placement cannot change it, because a bet equal to the declaration is automatically in the declaration’s class. Under the folk frame, a canonical bet prices at 1-in-220 and a non-canonical ordering of the same digits can never win at all. The frames answer different questions — scene pricing versus what this settlement code pays — and for the question “will this ticket win”, the machine’s frame is the one that pays. The chart is the practical arbiter: panas render exactly as declared, so a market’s own archive shows whether its declarations stay inside the canonical set.
The sangam spaces inherit the fork. Half sangam matches one ank and one exact panna: 10 × 1,000 = 10,000 machine cells, against the folk frame’s 10 × 220 = 2,200. Full sangam matches two exact panas: 1,000 × 1,000 = 1,000,000 machine cells against 220 × 220 = 48,400. One structural fact supports treating the two sessions as independent: the close declaration is produced from three digits without ever reading the open row — the code enforces only that close cannot be declared before open, never a value link.
Statistical Analysis of Results: What the Archive Supports
Statistics needs observations, and on this platform an observation is a declared session: three digits and a timestamp. A MAIN row produces at most 365 open and 365 close declarations a year; a jodi series, needing both, is at most 365 pairs — two rows are two samples, never one pooled 730, as the Milan guide established. The public jodi and pana charts render a rolling 365-day window, the Starline chart 90 days, and days without declarations render as empty or starred cells because the archive stores declarations, not calendar days.
| Statistic | Denominator per draw | Expected over 365 declarations |
|---|---|---|
| A named digit is declared (per session) | 100 of 1,000 | 36.5 |
| A named jodi is completed | 1 of 100 | 3.65 |
| A named panna is declared | 1 of 1,000 | 0.37 |
| A declared panna is single-class | 720 of 1,000 | 262.8 |
| A digit appears somewhere in the panna | 271 of 1,000 | 98.9 |
The recipe that survives review has five steps. Fix the window and write the extraction date down — both public windows are rolling, so a count taken last month is not reproducible. Extract declared sessions only, noting that starred or missing cells are absences, not zero results. Choose a statistic with a fixed denominator from the tables in this guide. Compare the observed count to its expectation. Then apply the ruler in the variance section before believing anything. Counts computed this way on the space are exact; empirical claims belong to whatever archive the operator has actually declared, scored the same way.
What the archive cannot support is the statistic everybody wants: a rate that changes. No chart column, window or denominator updates the probability of a draw — the space is the same 1,000 cells every session, which is why frequency-reading guides keep colliding with the same wall. The Starline guide’s thirteen slots a day add more of the identical mechanism; its counts get bigger, its probabilities do not.
Mathematical Models for Prediction: Fit Is Not Forecast
The structural fact first: nothing on this platform generates a matka result. A sweep of the codebase finds random number utilities in exactly four places — demo data seeding, OTP issuance, referral codes and the separate aviator crash game — and none in any result, declaration or matching service. Declarations arrive through admin paths as chosen digits. That means a probability model is always an assumption the analyst imposes on the record: “suppose the digits behave as if drawn uniformly from the 1,000 cells.” The platform neither guarantees that supposition nor publishes a process that would; and no archive of 365-day windows can distinguish a uniform draw from chosen digits that look uniform, because both produce counts inside the same noise bands.
Given the assumption, the difference between fitting and forecasting is the difference between describing yesterday’s counts and claiming tomorrow’s. Any flexible model fits any archive; a model that cannot be stated as a rule with a number and a failure condition is vocabulary. The standard-error test is the cheapest filter: a digit observed 42 times in 365 declarations has an observed rate of 0.115 against the expected 0.10, with a standard error of 0.0157 — about 0.96 deviations high. Indistinguishable from noise, and the multiple-comparisons table explains why some digit always looks hot somewhere on a 25-row board.
Transition tables — does one ank follow another — fail the same test from both ends. Empirically, each open-to-close cell expects 3.65 observations over 365 pairs with deviation 1.90, so the largest cell in any such table is ordinarily within the noise band. Structurally, the code gives no mechanism for dependence: the close declaration is produced from its own three digits without reading the open row. A model may assert dependence; the record offers it no support. The five-step falsifiability protocol in the Kalyan strategy guide remains the only honest way to promote any pattern from observation to rule.
Expected Value on the Configured Rates
Expected value is the one comparison that survives every argument about luck: multiply the win probability by the rate, and compare the product to the stake. The rates are configuration rows in the client config table. The initial seed wrote 9.5, 95, 140, 280, 700, 1,000 and 10,000; a later migration — literally named for updating game win rates — set the current 9.8, 98, 160, 320, 1,000, 1,000 and 10,000; and the code’s own fallback defaults differ again. Three published layers, one lesson: rates are configuration, and the in-app rate card is the only version worth feeding into the arithmetic.
| Bet family | Win event | Probability | Configured rate | Expected value | Hold |
|---|---|---|---|---|---|
| Single digit | ank equals named digit | 0.1 | 9.8 | 0.98 | 2% |
| Jodi | both anks match pair | 0.01 | 98 | 0.98 | 2% |
| Single panna | exact triple, positional | 0.001 | 160 | 0.16 | 84% |
| Double panna | exact triple, positional | 0.001 | 320 | 0.32 | 68% |
| Triple panna | exact triple, positional | 0.001 | 1,000 | 1.00 | 0% |
| Half sangam | ank + exact panna | 0.0001 | 1,000 | 0.10 | 90% |
| Full sangam | two exact panas | 0.000001 | 10,000 | 0.01 | 99% |
@1,000 cells, one matches@1 ÷ 1,000 = 0.001@160 per 1 staked@0.001 × 160 = 0.16Read the table as one sentence: the hold is a property of the family and its rate, not of the draw. All seven families settle from the same three digits. The digit and jodi rates are scaled to their 10 and 100-cell spaces at roughly 2 percent; the panna families sit on the full 1,000-cell space at rates far below break-even; the sangams compound two exact matches onto 10,000 and 1,000,000 cells. The triple panna row is the curiosity: 1,000 × 0.001 is exactly 1.00, zero hold — the one family where configuration and space meet. Under the folk 220-frame the same rate would imply an expected value above 4, which is one more reason the settlement frame is the one to compute in.
Two final configuration facts. No maximum win amount exists anywhere on the MAIN settlement path — the win amount is the stake times the rate directly, and the per-slot stake caps documented in the Starline guide are that vertical’s configuration, not a platform rule. And rates change by migration, as V88 proves on this very platform: a table computed today carries today’s date or it carries nothing. Day 03 owns the folk-frame price comparisons; Day 04 owns what the families feel like to play; this table is the settlement-frame version, and it is the one the code pays on.
Variance and Standard Deviation: The Ruler for Counts and Waits
Expected value is the centre; variance is the ruler that says when a count means something. For a count over n independent declarations of an event with probability p, the expectation is np and the standard deviation is the square root of np(1−p), with about 95 percent of outcomes within roughly two deviations. The Kalyan guide published the band for the digit family; the same machine produces every other family’s ruler:
| Count over 365 declarations | p | Expected | Std dev | Ordinary band |
|---|---|---|---|---|
| A named digit declared | 0.10 | 36.5 | 5.73 | 25 to 48 |
| A named jodi completed | 0.01 | 3.65 | 1.90 | 0 to 7 |
| A named panna declared | 0.001 | 0.37 | 0.60 | 0 to 2 |
| A single-class panna declared | 0.72 | 262.8 | 8.58 | 246 to 280 |
Waiting times have the cruellest shape in the whole subject. Between hits, the wait has mean 1/p and standard deviation the square root of (1−p) divided by p — nearly the same number. The digit wait averages 10 declarations with deviation 9.5; the jodi wait 100 and 99.5; the panna wait 1,000 and 999.5. A dry spell of two or three times the mean happens to everybody eventually: the chance a wait exceeds three times its mean is about 5 percent for every family on the board. Day 04 drew the behavioural consequence; the arithmetic here is its proof.
The unreduced digit sum earns one more visit. Its exact distribution spans 0 to 27 with mean 13.5 and standard deviation 4.97 — so a run of sums drifting from 12 to 17 is a quantity of typical size doing what quantities of typical size do. That the charts publish the reduced digit but never the sum is exactly why sum-based folklore survives: it reads a variable whose own spread, published here for the first time, explains every “streak” without needing one.
@36.5 ± 11.5 (2 SD)@3.65 ± 3.8 (2 SD)@0.37 ± 1.2 (2 SD)Practical Application: A Six-Step Math Sheet
Practical application is a worksheet, not a tip. The six steps below take two minutes with a phone calculator and they are the difference between arithmetic and folklore:
@family cells: 10, 100, 1,000, 10,000 or 1,000,000@in-app rate card, dated today@rate × probability, compare to 1@mean 1/p, deviation near the mean@rolling 365 or 90 days, extraction date written@observed vs expected ± 2 SD, reject outsideEach step exists because it kills a specific error. Step one kills class folklore — 720, 270 and 10 are shapes of the space, and every named triple in them is the same 1-in-1,000. Step two kills stale rates, which this platform’s own migration history has already invalidated once. Step three kills multiple worship, because 10,000 times zero is still zero. Step four kills “due”, since the wait has no memory. Step five kills sliding-window myths. Step six is the falsifiability protocol compressed to one line, and it is the step that ends most arguments.
What the sheet does not do is set stake sizes — that is bankroll arithmetic, and the guides for it (Day 07 on failure modes, Day 04 on losing runs) presume the numbers this sheet produces. The platform enforces no per-day or per-market exposure limit, so every cap is self-imposed; the sheet’s expected-value column is the coldest possible input to choosing one. A family returning 0.16 per rupee does not become affordable by being staked in smaller pieces.
What the Mathematics Cannot Do
Honesty requires the limits to be as explicit as the numbers. First, uniformity is an assumption, not a finding: the record stores declarations, publishes no generating process, and keeps windows too short to certify one. The probabilities in this guide are conditional on the uniform model — the benchmark against which any archive can be scored, not a guarantee about any operator’s next digit. Second, everything configuration-dependent is dated: the rate table is the V88 migration’s values as of this post’s date, the settlement frame is the code as of this post’s date, and both can change — the matcher’s own comment claims an order-independence its code does not perform.
- No forecasting power: nothing in this guide, or in any guide on this site, changes what the next three digits will be; the space is the same 1,000 cells every session.
- No fairness certification: the platform neither publishes a draw mechanism nor claims one; the uniform model is the analyst’s assumption, stated as such.
- No exposure limits: the platform enforces no per-day, per-session or per-family loss cap; every limit is the reader’s own, set before play.
- Configuration drifts: rates, windows and even matching behaviour are migrations and code away from changing; date everything you compute.
What remains when the limits are drawn is still worth having: a fixed space, seven prices, and a ruler. The mathematics of this platform tells you exactly what a ticket costs in expectation and how wildly the ride to it will swing. It will never tell you the next number — and any source claiming otherwise is selling something this record does not contain. For readers aged 18 and over; play responsibly, if at all.
Frequently Asked Questions
What is the probability of a single digit bet winning?
Is a panna a 1-in-220 bet or a 1-in-1,000 bet?
What does expected value mean on this platform?
Why do some bet families hold 2 percent and others 84 percent?
What is variance in Matka terms?
Can a mathematical model predict the next result?
How many observations does a market actually produce?
Does a bigger payout multiple mean a better bet?
Download the Official Shree Matka App
Experience real-time live results, complete historic panel records, and 24x7 verified automated withdrawals on your Android smartphone.
Download App
Comments (0)
Loading comments...