
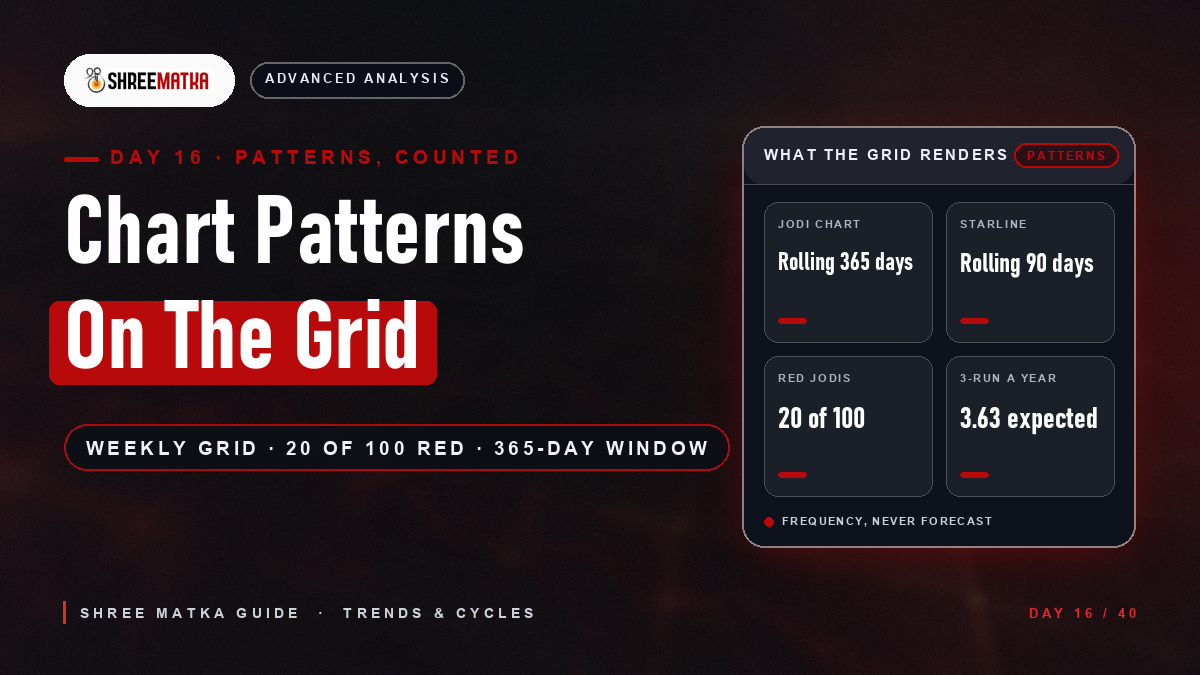
What the Chart Grid Actually Renders
Pattern recognition starts with an honest look at the surface, because the grid is not a photograph of the game — it is a rendering decision made in code. The public jodi and pana charts build one row per calendar week, anchored on Monday and ended on Sunday, from the declared market days inside a rolling 365-day window. Weeks are assembled oldest first, then the finished list is reversed, so the newest week sits at the top of a live chart; the archive query orders declarations by date descending before any of that happens. Every visible number is computed afterwards from stored digits.
@one calendar week, Monday to Sunday@newest week first (the list is reversed)@rolling 365 days for jodi and pana@“***”, “**”, “***”Those four rules decide more pattern arguments than any digit does. Two readers can disagree about the same market because one is counting declarations and the other calendar days, and the starred cells are where that difference hides: an absent session, never a zero result. The window also rolls one day further every day, which is why a count needs the date it was taken written beside it.
The colour rule is the most quoted thing on any Matka chart, and it is one line of code: a jodi is highlighted when its two digits are equal or differ by exactly five. That is 20 of the 100 possible jodis — ten doubles and ten cut pairs — so roughly one declared day in five arrives red before anyone has formed an opinion about it. The rule only inspects real two-digit jodis, so a starred placeholder can never be red. The Kalyan strategy guide works through what that ±5 relation does and does not imply; here it is the baseline rate a colour pattern must beat.
| Chart surface | Window it reads | Layout | Red highlight |
|---|---|---|---|
| Jodi chart | rolling 365 days | weekly grid, newest week first | 20 of 100 jodis |
| Pana chart | rolling 365 days | weekly grid, newest week first | same 20-of-100 jodi rule |
| Starline chart | rolling 90 days | flat day rows | not rendered |
| Jackpot chart | every declared day it holds | flat day rows | not rendered |
Two of those surfaces are weekly grids and two are flat lists, and only the grids separate weekdays — which is where a cycle claim has to be read from. Check which table a count came from before trusting it.
What the grid does not render matters just as much. There is no pattern column, no cycle column, no trend column, and nothing labelled hot or due anywhere in the schema — the record holds six digits per session, two timestamps and a published flag. The only calendar structure the schema encodes is the week’s Monday anchor — a layout choice, not a rule about which days produce results. Anything resembling a cycle is assembled by the reader’s eye out of a table whose only job was legibility.
Types of Chart Pattern: The Five Families
Every pattern claim ever made about a chart falls into one of five families, and naming the family is half of testing the claim, because each one sits on a different denominator. The table counts a market-year as 365 declarations of one market row — the same unit the Milan guide insists on, since two sessions are two samples and never one pool of 730. Definitions of the objects themselves (ank, jodi, panna, panel) belong to the glossary; this taxonomy is about the shapes readers draw between them.
| Pattern family | What the reader is claiming | Denominator per market-year | Expected count |
|---|---|---|---|
| Repeat | the same ank twice running | 364 adjacent pairs | 36.4 |
| Streak | the same ank three or more running | 363 possible starts | 3.63 for three |
| Cycle | the same value on a fixed calendar gap | 350 three-week weekday starts | 3.50 |
| Label | a red jodi appears | 365 declarations at 20 of 100 | 73 |
| Trend | a column drifts one way for a stretch | no fixed denominator at all | not computable |
The first four families have exact expectations because they are counts of independent events over a known number of chances. The fifth does not, and that is the whole story about trends: “drifting” is a statement about a window a reader chose after looking, so it has no denominator to divide by. A repeat and a streak are the same mechanism at different lengths — a streak of three is a repeat that continued — and both are pure arithmetic, which the next section works through in full.
One more family is worth separating from these five because it is invisible to the eye: the selection of the family itself. Deciding to watch the open digit, or the close digit, or the jodi, or this market rather than that one, is a choice made from 25 MAIN rows, two sessions a day and a dozen betting families. The Rajdhani guide quantifies what that freedom costs — the more places a pattern could live, the more certainly one of them will appear to.
Cycle Length Identification: Why Threes Are Furniture
A cycle length is a gap between repetitions, and gaps have denominators too. Take the classic: the same digit appearing on the same weekday three weeks running. In a 52-week year a given weekday offers 50 eligible three-week windows, and the grid shows seven weekdays, so one market row provides 350 starts. A start becomes a cycle when the second and third weeks each match the first, which is 1-in-10 × 1-in-10 = 1-in-100. Expected: 3.50 completed cycles per market-year.
@52 − 2 = 50@7@7 × 50 = 350@1 ÷ 100 = 0.01@350 × 0.01 = 3.50That last line is the one to sit with. Roughly eighty-eight three-week weekday cycles form every year on a board nobody is trying to make cycle — and a reader who scans the charts hub for one will find it, because the finding rate is the scheduled rate. Multiply-out logic makes rarer cycles rarer still: the same claim at jodi level drops to 0.035 per row, which is still about 0.9 platform-wide, and at four-week length a single row sees 0.35 of them a year.
Streak lengths behave the same way, with a sharper fall. The expectation for a run of at least k identical ank digits is (365 − k + 1) × (1/10)(k−1), computed once and printed for every length the reader will ever encounter:
| Run length | Expected per market-year (ank, 1-in-10) | Expected per market-year (jodi, 1-in-100) |
|---|---|---|
| 2 running | 36.4 | 3.64 |
| 3 running | 3.63 | 0.036 (about one per 27.5 years) |
| 4 running | 0.36 (about one per 2.8 years) | 0.0004 (one per about 2,800 years) |
| 5 running | 0.036 (about one per 27.7 years) | far below one in a lifetime |
The two numbers readers confuse most are the count and the presence, so both are given here. Simulation over one million synthetic market-years puts the chance that a year contains at least one three-run of some digit at 0.965 — call it 97 percent — while the expected number of three-run starting positions is 3.63. Both statements are about the same arithmetic: three-runs are furniture of the grid, and virtually every archive contains one to point at. What would be news is a five-run, which arrives once in about 28 years of one row.
The schedule offers cycles no help. The platform has a table for weekday closures — the schema, added in migration V46, that would make a market open on some weekdays and not others — and it ships with zero rows, so every seeded market runs every day of the week. There is no Tuesday gap to find, no weekend behaviour to model, and no configured rhythm for a cycle claim to be true about other than chance.
Trend Continuation vs Reversal: One Digit, Two Stories
Continuation and reversal are the two stories told about the same indifferent event. After any sequence of declarations — three of the same digit, three of different digits, a red pair, a dry stretch — the next digit equals the last one with probability 1-in-10 and does not with probability 9-in-10, unchanged. The continuation reader treats the 9-in-10 break as the anomaly to explain; the reversal reader treats it as the correction that was owed. Both are describing one stored row of six digits after the fact.
The record explains why neither story has leverage. A close result is produced from its own three digits and the only ordering the code enforces is that the close cannot be declared before the open — a sequencing rule, not a value link. There is no RNG anywhere on the result path to be biased, no generator to be in a phase, and no state carried between declarations. The “machine” the pattern is supposed to reveal is an archive.
Where a trend genuinely helps is not prediction but bookkeeping: a declared change in what you are doing. The bet-behaviour guide covers the failure mode of “the trend turned, so raise the stake”, which is a money decision wearing a chart costume. A pattern’s useful job is to be a written rule you can score, and the scoring rules are next.
Pattern Reliability Assessment: The Band Test
A pattern is reliable to the degree its observed frequency differs from the frequency chance predicts. That is testable, and the ruler is the same band arithmetic the statistics guide derives: over n chances at probability p, a count expects np with standard deviation the square root of np(1−p), and about 95 percent of ordinary counts land inside two deviations. Printed for every family in the taxonomy:
| Count over a market-year | Expected | Standard deviation | Ordinary band (±2 SD) |
|---|---|---|---|
| A red jodi is declared | 73.0 | 7.64 | 58 to 88 |
| A named digit hits | 36.5 | 5.73 | 25 to 48 |
| An adjacent repeat occurs | 36.4 | 5.72 | 25 to 48 |
| A three-run starts | 3.63 | 1.90 | 0 to 7.4 |
| A three-week cycle completes | 3.50 | 1.86 | 0 to 7.2 |
| A named jodi repeats | 3.64 | 1.90 | 0 to 7.4 |
Read the band before the pattern. A year with 84 red days looks like a change in the market and sits comfortably inside 58 to 88; a digit seen 45 times looks hot and is inside 25 to 48. The three-run and cycle rows have bands that start at zero, which is the honest way to say that seeing none is ordinary and seeing several is also ordinary. Only a count outside its own band deserves a second look — and even then the Kalyan guide’s protocol decides whether the second look means anything.
Two honest negatives belong in the assessment. First, these bands assume declarations behave as if drawn uniformly from ten digits — the benchmark the archive can be scored against, not a guarantee about an operator, since nothing on the result path generates a number. Second, both public windows roll, so a count is a snapshot of a sliding window and must carry the date it was taken; a pattern that only exists in last quarter’s screenshot has not been assessed at all, merely remembered.
Combining Multiple Patterns: Filters Shrink, They Do Not Strengthen
Combining patterns is where the intuition breaks hardest, because stacking feels like triangulation and arithmetically it is division. Requiring a red jodi and the same digit as last week on the same weekday asks for 0.20 × 0.10: seven or eight qualifying days in a market-year instead of 365. Each added filter shrinks the sample the claim can point at while leaving every probability exactly where it was.
@0.20 per declaration@0.10 per start@0.20 × 0.10 = 0.02@365 × 0.02 = 7.3| Filters stacked on one declaration day | Combined probability | Qualifying days per market-year |
|---|---|---|
| One: the jodi is red | 0.20 | 73.0 |
| Two: plus the digit repeats last week | 0.02 | 7.3 |
| Three: plus the digit repeats the day before | 0.002 | 0.7 |
| Four: plus a three-run starts that day | 0.00002 | one every 140 years |
Each row adds what a tipster would call confirmation and costs a factor of ten in opportunities, until the fourth line describes an event rarer than the streaks the same reader calls ordinary. The next digit’s chances are unchanged at every row.
The deeper problem is that combined patterns are usually not independent observations of anything: they are several readings of the same six stored digits, which is the triple-counting trap the Kalyan guide names. Three kinds of genuinely independent material exist — the other session of the same day, another day of the same row, another market entirely — and a stack built from one declaration’s digits is one observation wearing three labels, not evidence three times over.
There is a version of combining that does work, and it is not about the digits: combining a pattern with rules that were always about the reader. A written stake cap, a per-market ceiling and a review date are independent of the draw, so they change the outcome distribution of your money even though they change nothing about the chart. The market-card guide covers what a running board looks like in practice; the sheet below puts the pattern claim and the money rules in the same six lines.
Pattern-Based Strategy: A Six-Step Pattern Sheet
A pattern-based betting strategy is a decision process with a scoring stage. The six steps below are arranged so that the pattern earns its place before any money does:
@jodi or pana chart, market row, window length@both public windows roll; undated counts die@repeat, streak, cycle or label@denominator × probability, from the tables above@outside ±2 SD is a second look; inside is nothing@written before the next session, reviewable afterSteps two and five are the ones that end arguments. An extraction date makes the count reproducible, which is the minimum condition for anyone else checking it; a band test makes the sighting comparable to chance, which is the minimum condition for the claim to be falsifiable. A pattern that cannot survive those two lines is not a weak pattern — it is not a pattern claim at all, just a description of a grid.
Step six needs the platform’s honest context: nothing in the record enforces an exposure limit, a cooling-off period or a loss cap, so every ceiling in that line is self-imposed and every stake rule is a promise made to yourself in advance. The platform-verification guide documents that absence in detail. A pattern sheet is a place to write those limits down; it cannot invent them.
What Chart Patterns Cannot Do
The limits of this subject are as concrete as its arithmetic, and they belong in front of any pattern discussion:
- Rendering is not mechanism: the weekly grid, the Monday anchor and the newest-first order are layout decisions in the chart code; nothing in the schema stores a cycle, a trend, a hot row or a due number.
- Frequency is not forecast: a three-run is expected 3.63 times per market-year and about 97 percent of years contain at least one; knowing that is what makes finding one unsurprising.
- Colour is a label: 20 of the 100 jodis are red by rule, so roughly one day in five arrives highlighted whatever the market does.
- Independence is the assumption: the bands treat digits as if drawn uniformly; the platform publishes no draw process and runs none on the result path, so the model is a benchmark, never a certification.
- No exposure limits exist: no per-day, per-market or per-family cap is enforced anywhere in the record; every limit in the sheet is self-imposed.
What survives the limits is genuinely useful: a taxonomy with a denominator per family, the bands that make a sighting comparable to chance, and a sheet that forces a pattern to be written, dated and scored before it is trusted. That is all pattern literacy offers — a way of not being fooled by a grid, not a way of reading the next result off it. For readers aged 18 and over; play responsibly, if at all.
Frequently Asked Questions
What are chart patterns in Satta Matka?
How do I identify a cycle length in a Matka chart?
What do the red numbers on the chart mean?
Can chart patterns predict the next result?
What is trend continuation versus reversal?
How reliable are Satta Matka chart patterns?
Should I combine several patterns to get a stronger signal?
Why do some chart cells show stars instead of numbers?
Download the Official Shree Matka App
Experience real-time live results, complete historic panel records, and 24x7 verified automated withdrawals on your Android smartphone.
Download App
Comments (0)
Loading comments...