
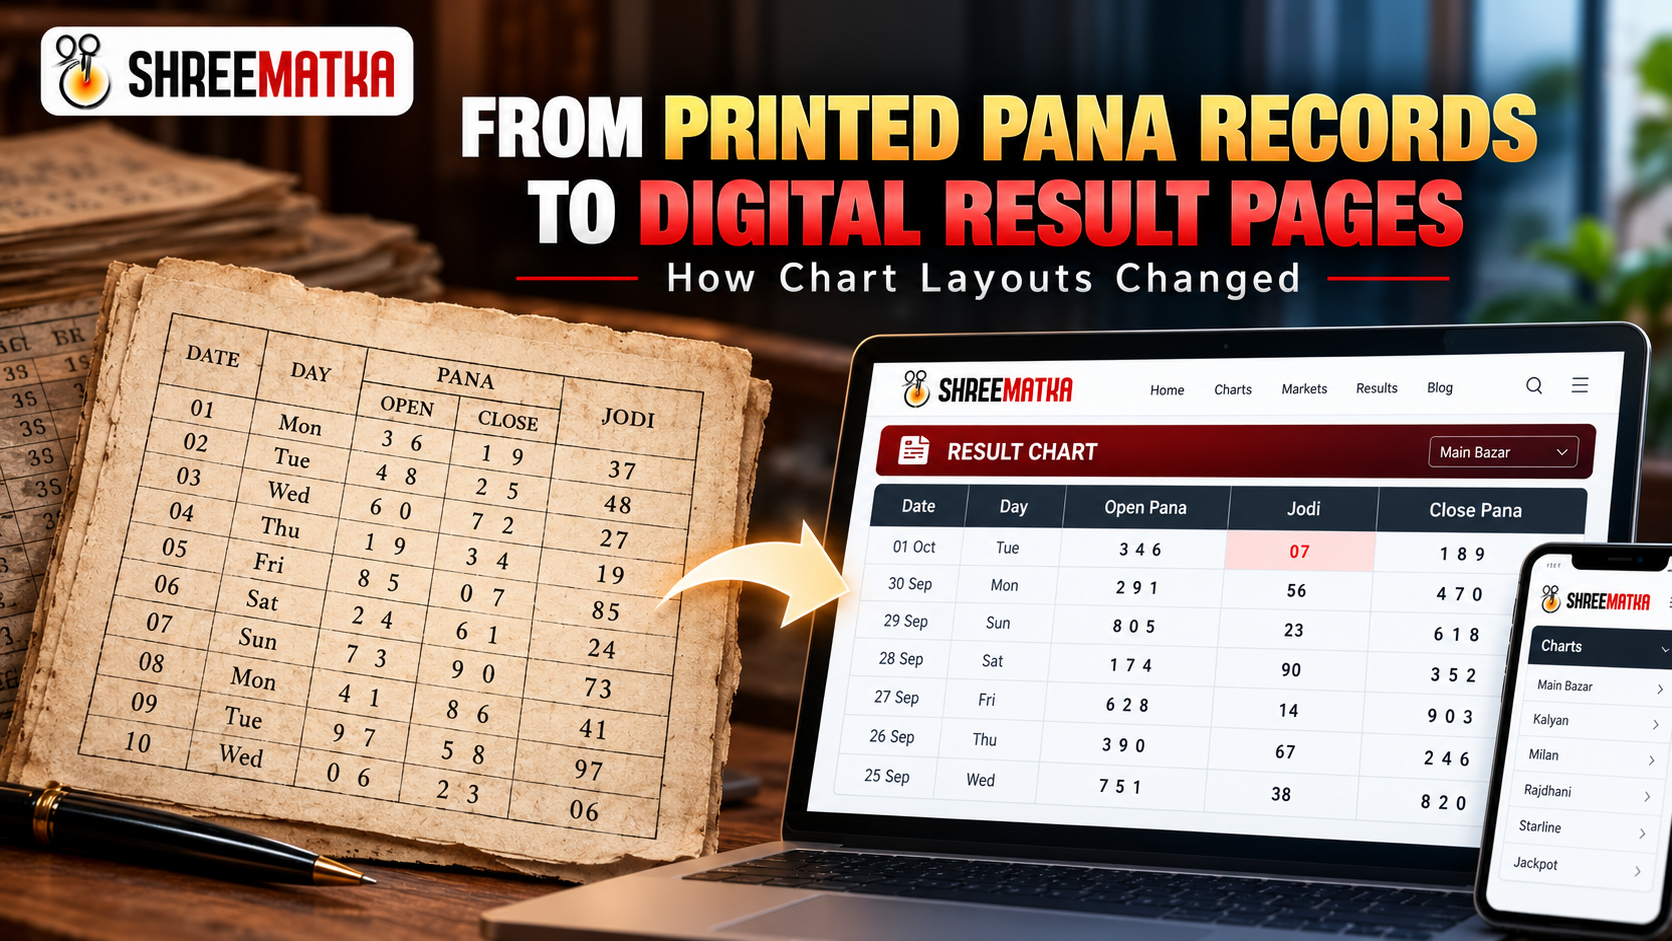
A draw result and the layout used to display it are two distinct things. An empirical outcome such as an Open Pana of 560 and a Close Pana of 347 remains mathematically identical whether inscribed in a handwritten physical ledger or rendered on a high-density smartphone display. The shift from physical print to digital tables changed the accessibility, searchability, and formatting density of chart data—not the historical events themselves.
When examining historical Satta Matka records, readers frequently encounter two completely different presentations of the exact same event. In one context, a record appears as a dense, sequential line in a printed circular or paper booklet. In another, it sits inside a responsive calendar-style web matrix, complete with interactive sorting, colored badges, and links to related market histories.
Understanding how chart layouts evolved helps clarify what a digital interface genuinely improves—such as retrieval speed and visual structure—and what remains a constant challenge, such as verifying source accuracy and auditing historical gaps. This article explores that transition without relying on fabricated folklore or unverified timeline claims.
Before the Digital Page: How Physical Records Were Organized
Before internet connectivity and mobile applications became the dominant distribution channel, game records relied on physical mediums. While detailed archival documentation from the mid-twentieth century remains fragmented, reliable historical accounts and standard printing constraints illustrate how paper-based records functioned:
- Fixed Physical Boundaries: A paper ledger, pamphlet, or printed broadsheet possesses immutable dimensions. Typesetters and ledger keepers had to balance readability with space constraints, often forcing compact abbreviations.
- Chronological Serial Entries: Results were primarily recorded in simple vertical sequences as each session closed. Finding a specific date required manual scanning down successive columns or flipping through dated physical folios.
- Vulnerability to Physical Degradation: Ink smudges, paper weathering, and typesetting typos could permanently obscure a digit. Once distributed, a misprinted entry could not be retroactively patched without publishing a physical errata slip.
- Localized Distribution: Physical records existed where they were printed and physically delivered. Cross-referencing an entry from one market against another in a distant regional hub was slow and logistically constrained.
These physical limits explain why early record-keeping often prioritized simple chronological logs over complex multidimensional matrix layouts. A weekly grid required substantial horizontal space that smaller pamphlets could rarely afford.
Why a Consistent Record Layout Matters
Whether on paper or on a screen, the usefulness of an informational table depends on structural consistency. When dates, labels, and digit positions shift unpredictably, human readers and automated software struggle to extract meaning.
In Matka record-keeping, a standard draw involves multiple discrete data fields:
- The calendar date and applicable day of the week.
- The market identifier (e.g., Kalyan, Main Bazar, Milan Day).
- The 3-digit Open Pana panel.
- The 2-digit central Jodi pair.
- The 3-digit Close Pana panel.
If a table switches the order of Open and Close panels, omits the day of the week, or fails to maintain fixed two-digit widths for Jodis (such as truncating 03 to 3), the entire historical continuity is compromised. Consistent layouts ensure that analysts can reliably compare entries across weeks, months, and years.
From Individual Entries to Structured Chart Views
The most significant structural evolution in chart design was the transition from individual linear logs to weekly calendar matrices. Consider the conceptual difference between how the same raw records can be presented:
In Format A, entries are listed sequentially, emphasizing time-stamped history. In Format B, entries are organized into a calendar grid where each column represents a day of the week (Monday through Sunday). This weekly grouping allows observers to visually track daily cycles across successive weeks without calculating date offsets manually.
What Changed With Digital Result Pages?
Modern web architectures—like the system powering Shree Matka—introduced functional capabilities that were physically impossible on paper:
- Immediate Dynamic Publishing: When a session concludes, the backend publishes the declared result to the database, instantly updating the homepage market card and appending the new record to the chart archive without physical reprinting.
- Hyperlinked Relational Navigation: A reader inspecting a live market card on the homepage can immediately click through to that market's historical Kalyan Jodi Chart or Main Bazar Panel Chart.
- Separate Summary and Detailed Views: Rather than crowding every panel into one massive, unreadable table, digital systems cleanly separate compact Jodi summaries from tripartite Pana archives.
- Responsive Viewport Adaptation: Modern CSS and table containers permit dense tabular data to remain legible across a 390px mobile screen as well as a 1440px desktop monitor.
- Centralized Archival Retrieval: Historical records spanning multiple calendar years are indexed in databases and retrieved in milliseconds, eliminating the physical burden of maintaining decaying paper books.
Jodi Charts and Panel/Pana Charts as Different Views
A core distinction in modern digital presentation is the separation between Jodi Charts and Panel (Pana) Charts. These two views present different granularities of the same underlying event:
| Feature Dimension | Compact Jodi Chart View | Full Panel / Pana Chart View |
|---|---|---|
| Data Density | Compact: Displays only the 2-digit Jodi pair (e.g., 14). |
Full: Displays Open Pana, Jodi, and Close Pana (e.g., 560 - 14 - 347). |
| Cell Complexity | Single numerical value per day cell. | Tripartite vertical or grouped stack of three distinct numbers. |
| Primary Analytical Use | Scanning broad weekly patterns, red jodis, and high-level digit distribution. | Auditing full session declarations, panel sums, and specific patti combinations. |
| Visual Footprint | Small: Fits comfortably across narrow smartphone displays. | Wide: Requires horizontal scrolling or columnar compression on mobile. |
Neither view is "better" than the other; they are complementary perspectives. For readers interested in how panel sums mathematically derive the central Jodi pair, consult our comprehensive Satta Matka Jodi & Panel Chart Guide or our specialized walkthrough on Kalyan Matka Chart Reading.
What Digital Archives Make Easier—and What They Cannot Guarantee
While digital charts provide unparalleled convenience, users must recognize the operational limitations of online archives:
A sleek, modern interface does not independently verify the accuracy of historical data. If an incorrect digit was entered into a database during digitization, a responsive CSS table will display that incorrect digit with high fidelity. Digital presentation enhances accessibility, but verifying primary source reliability remains essential.
Key realities of digital record-keeping include:
- Historical Gaps: Older records from decades past often contain missing dates where historical logs were lost prior to digital transcription.
- Browser Caching: A web browser may cache an older version of a result page, showing yesterday's declaration until a hard refresh is executed.
- Cross-Site Discrepancies: Different third-party websites frequently display conflicting numbers for the same market session due to transcription delays or scraping errors. We examine why these variances occur in our guide on Why Matka Results Differ Between Websites.
- No Predictive Power: The fact that historical numbers can be viewed in an orderly digital grid does not make future random draws predictable. Historical records serve exclusively as retrospective audit logs.
How to Read a Modern Chart Layout Carefully
When inspecting any digital chart on Shree Matka or elsewhere, use this 5-point verification checklist to ensure you are interpreting the data accurately:
***-**-*** or 560-1*-***), it indicates that the draw has not concluded or is currently running, not that a numerical glitch occurred.
Frequently Asked Questions
Conclusion & Key Takeaways
The shift from physical paper records to modern digital result pages represents an evolution of medium, not a change in historical facts. To summarize:
- The Medium Changed, Not the Numbers: A draw result is an empirical event; how it is displayed—in linear logs or weekly grids—is an editorial design choice.
- Layouts Enable Context: Calendar-style matrices organize historical data into comprehensible weekday rhythms that simplify retrospective research.
- Verification Remains Vital: Digital convenience does not guarantee error-free history. Readers should confirm market names, check timestamps, and distinguish compact Jodi summaries from full Pana archives.
Editorial & Responsible Information Notice: This article is published exclusively for informational, historical, and archival education purposes. Shree Matka does not offer prediction formulas, winning guarantees, or wagering advice. Real-money gaming involves financial risk and may not be legally permitted in all jurisdictions. Users must be 18 years of age or older.